


Statistics
Industry At A Glance
IN MANITOBA
- Manitoba had 19 hatching egg producers and 125 registered broiler (meat) chicken producers.
- Over 97% of all registered hatching egg and chicken farms in Manitoba are family owned and operated.
Broiler Hatching Eggs
- The average size for a broiler hatching egg farm was 13,610 hens producing 2.1 million eggs annually.
- The smallest farm produced 1,550,000 eggs every year and the largest produced 4.65 million eggs.
- Manitoba’s hatching egg production for 2024 was 42.1 million eggs, down 1.85% from 2023. Manitoba hatcheries imported 3.61 million eggs, down 2.75% from 2023.
- In 2024 locally produced eggs accounted for 92.7% of the total eggs set at Manitoba hatcheries.
- The average hatchability of Manitoba broiler hatching eggs was 85.9% in 2024. Import egg hatchability was 83.4%.
- Hatching egg producers are paid based on the number of saleable chicks. The producer price as of December 31, 2024, was 74.79 cents for every saleable chick. This is 0.41 cents lower than the previous year.
- Manitoba had 3 hatcheries.
Broiler Chickens
- Manitoba had 125 registered chicken farms, located mainly in the southeast corner of Manitoba.
- The average farm raised 75,267 kg of chicken every 7 weeks.
- The largest farm raised 643,778 kg of chicken every 7 weeks. The smallest farm raised 30,000 kg every 7 weeks.
- Most chickens were ready to market when they weighed just under 2 kg. It takes 30-34 days for chickens to reach this weight. These chickens are called “broilers”.
- Total chicken production in 2024 = 55.6 million kg eviscerated, down 0.3 million kilograms from the previous year.
- Production in Manitoba increased 24.7% from 2014 to 2024.
- Manitoba had 4% of the total Canadian chicken production. Ontario and Quebec had the greatest market share at 35% and 26% respectively.
- The average price paid to a Manitoba producer for 1 kg of live chicken in 2024 was $2.1260 (2023 = $2.1826, 2022 = $2.1371).
- Manitoba has 2 federally inspected chicken processing companies – Sunrise Poultry Co. (operating as Dunn-Rite Food Products) and Exceldor Cooperative (commonly known as Granny’s Poultry Co-operative Ltd.). There are two provincially licensed companies – Waldner Meats, and Favour-Rite Food Products Ltd.
IN CANADA
- Canada ranks 18th on the list of leading chicken producing countries. In 2024 Canada raised 1.40 billion kilograms evis. The United States tops the list, producing 21.08 billion kgs in 2024. China and Brazil are second and third with 15.35 billion kgs and 15.00 billion kgs respectively.
- Canada is 20th on the list of leading chicken importers, bringing in 185 million kgs in 2024. By contrast, Canada ranks 11th on the list of leading chicken exporters, sending 149 million kgs of chicken around the world.
- The Consumer Price Index (CPI) for chicken in 2024 was 210.7 (2002=100). The CPI for all foods was 184.3. In comparison, the American 2024 CPI for chicken parts was 291.2 and 330.3 for all foods.
- Chicken retained its lead as the #1 meat choice in Canada with 40.3% of total meat consumption. In the United States, chicken also leads with a 53.3% share of total meat consumption.
- Canadians ate 34.8 kgs of chicken per person in 2024. Canada had the 20th highest per person chicken consumption in the world in 2024. Qatar led the world with 64.9 kgs per person followed by Peru (55.8 kgs), Australia (53.4 kgs) and United States (53.3 kgs).
- Data for 2019 – 2024 is unavailable: In Canada in 2018, 59% of chicken consumed was purchased at a retail outlet. 24% was purchased from a fast food outlet, 11% from a full service restaurant and 5% was served in hotels and institutions.

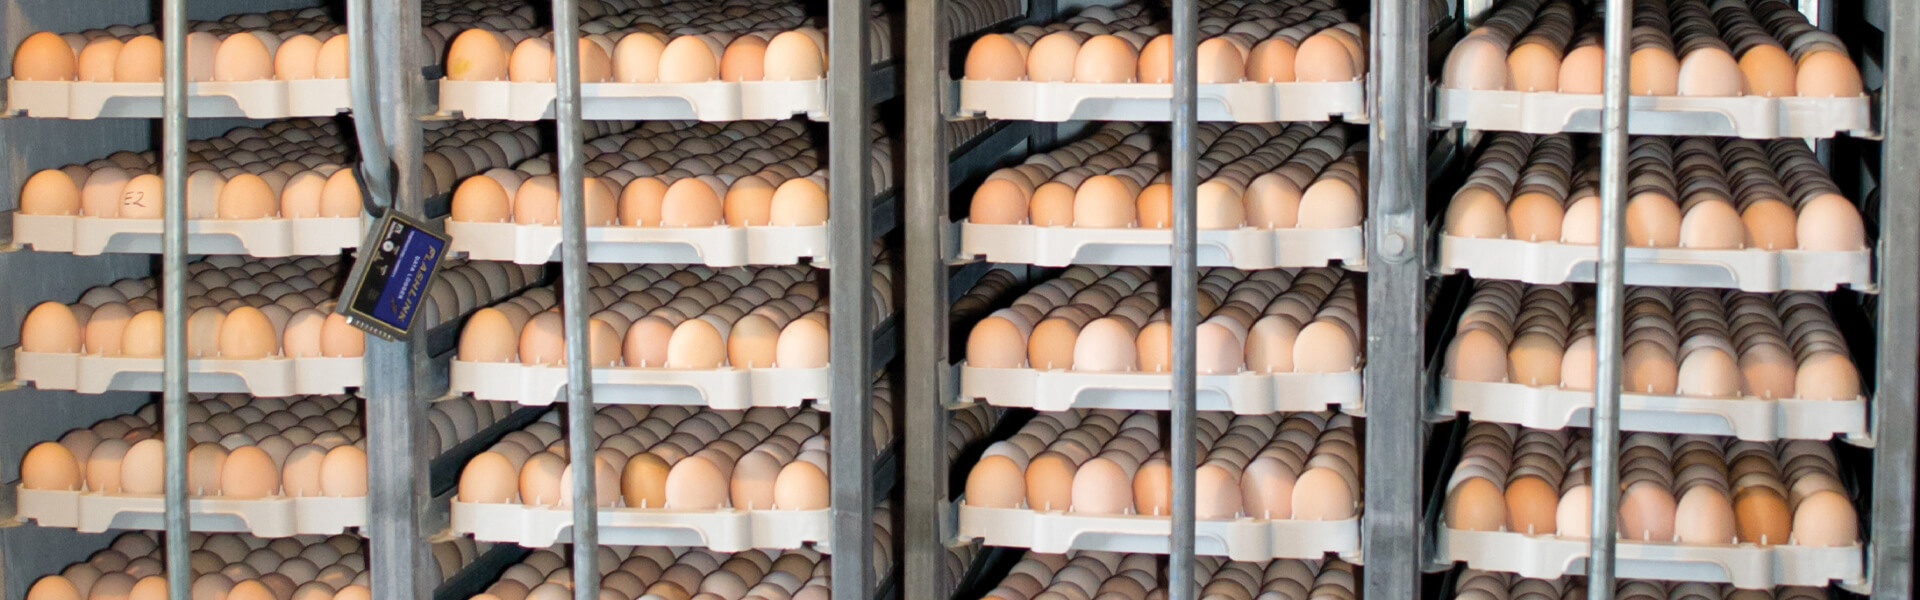
Hatching Egg Production
Manitoba hatching egg production decreased by 1.85% from 2023, resulting in a quota utilization of 104.32%. Domestic egg hatchability was increased by 0.9% from the previous year. Imported eggs decreased by 2.75% and imported chicks increased by 114.50% compared to 2023. The percentage of Manitoba chicks placed in Manitoba decreased 0.3%.
| 2025 | 2024 | % change | ||
| Total Eggs Set | 46,939,687 | 45,726,409 | 2.65 | |
| Manitoba Allocation (eggs) | 39,140,642 | 40,374,993 | -3.06 | |
| Lease Pool – purchased | 0 | 0 | ||
| Lease Pool – sold | 0 | 0 | ||
| Total Allocation | 39,140,642 | 40,374,993 | -3.06 | |
| Manitoba Production | eggs set | 42,477,127 | 42,120,409 | 0.85 |
| % of total eggs set | 90.49% | 92.11% | ||
| chicks hatched | 36,449,209 | 36,165,860 | 0.78 | |
| hatchability | 85.8% | 85.9% | ||
| % Manitoba chicks placed in Manitoba | 90.9% | 92.7% | ||
| Quota Utilization | 108.52% | 104.32% | ||
| Imported Eggs | eggs set | 4,462,560 | 3,606,000 | 23.75 |
| % of total eggs set | 9.51% | 7.89% | ||
| chicks hatched | 3,747,663 | 3,008,383 | 24.57 | |
| hatchability | 84.0% | 83.4% | ||
| Imported Chicks | 71,690 | 2,145 | 3242.19 | |
| Interprovincial movement | eggs set | 0 | 0 | |
| IP chicks hatched | 0 | 0 | ||
| chicks received | 31,745 | 30,100 | 5.47 | |
| chicks shipped out | 209,500 | 192,712 | 8.71 | |
| Saleable chick price as of Dec 31 | $0.7669 | $0.7479 | ||
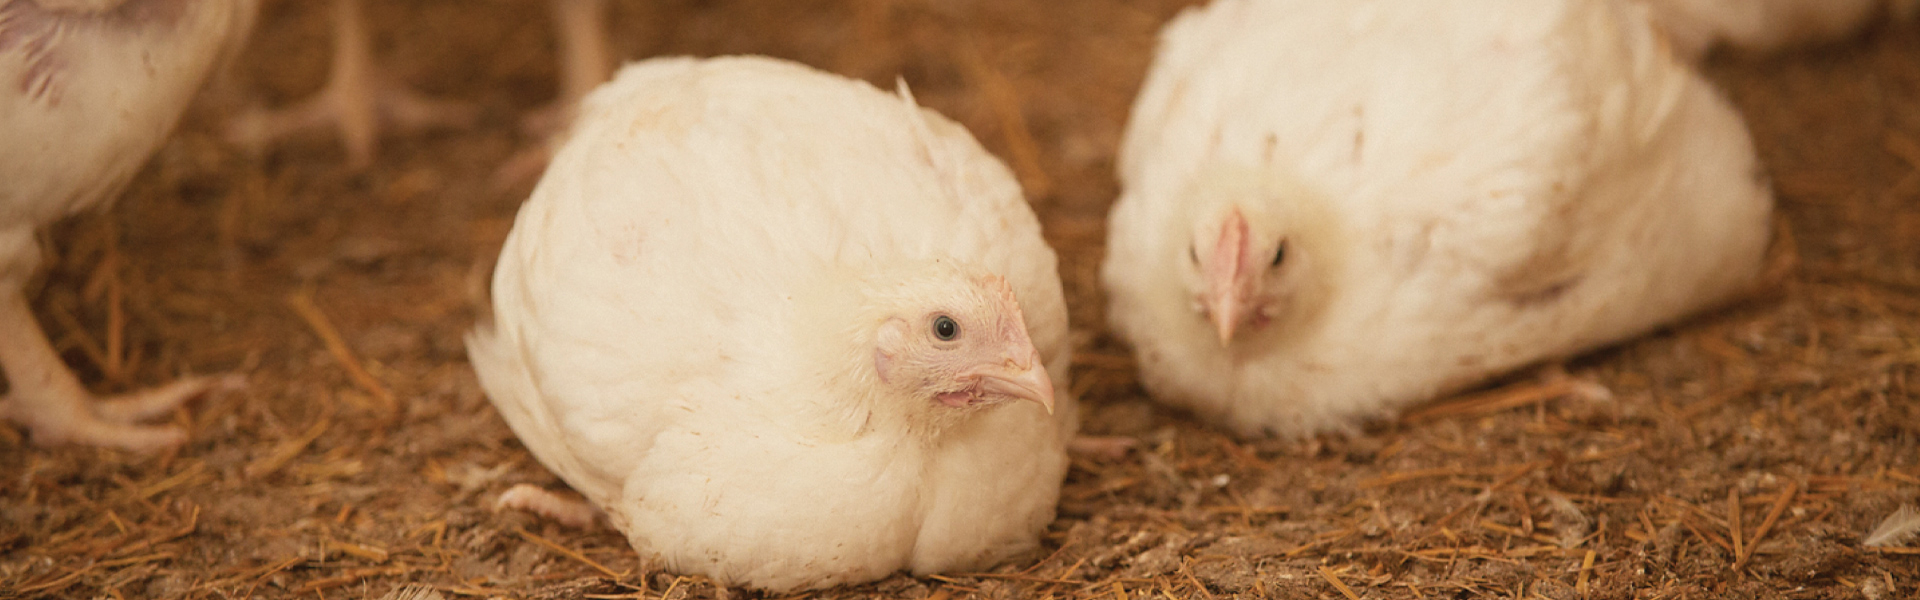
Broiler Production Level and Price
| PERIOD | DATES | PRODUCTION LEVEL (%) | PRICE/KG ($) | |
| A-205 | Oct 18 – Dec 12, 2026 | TBD | TBD | |
| A-204 | Aug 23 – Oct 17, 2026 | 109.8 | TBD | |
| A-203 | June 28 -Aug 22, 2026 | 113.11 | TBD | |
| A-202 | May 3 – June 27, 2026 | 111.70 | 2.076 | |
| A-201 | March 8 – May 2, 2026 | 111.92 | 2.061 | |
| A-200 | Jan 11 – Mar 7, 2026 | 104.30 | 2.116 | |
| A-199 | Nov 16 – Jan 10, 2025 | 102.42 | 2.072 | |
| A-198 | Sep 21 – Nov 15, 2025 | 108.56 | 2.055 | |
| A-197 | Jul 27 – Sep 20, 2025 | 114.18 | 2.068 | |
| A-196 | Jun 1 – Jul 26, 2025 | 118.4 | 2.080 | |
| A-195 | Apr 6 – May 31, 2025 | 107.1 | 2.096 | |
| A-194 | Feb 9 – Apr 5, 2025 | 102.0 | 2.076 | |
| A-193 | Dec 15, 2024 – Feb 8, 2025 | 97.0 | 2.095 | |
Broiler Quota Utilization
The average quota utilization for A-188 to A-193 was 100.83%. This is a decrease from 2023 at 102.40%. The averages for the western provinces and Canada were 99.49% and 99.75% respectively
| ALLOCATION | ACTUAL PRODUCTION | UTILIZATION | |
| Period | kg. live | kg. live | % |
| A-194 | 11,404,922 | 11,634,165 | 102.0 |
| A-195 | 12,011,129 | 12,097,599 | 100.7 |
| A-196 | 12,678,410 | 12,887,505 | 101.6 |
| A-197 | 12,229,547 | 12,094,606 | 98.9 |
| A-198 | 11,823,819 | 11,611,033 | 98.2 |
| A-199 | 11,205,044 | 11,056,985 | 98.7 |